

The carbon footprint of fish food is the total greenhouse gas (GHG) emissions generated across a feed's lifecycle, expressed as kg CO2-equivalents per kg or per tonne of feed produced. Three things every buyer should know immediately:
- Feed dominates aquaculture emissions. Feed-related activities account for 50%–80% of farm-gate GHG in many farmed species, making it the single biggest lever available.
- FCR multiplies your footprint. Feed conversion ratio (FCR) links every kg of feed to the fish biomass it produces. A poor FCR means more feed, more emissions, per kg of fish grown.
- Ask for LCA data. Life cycle assessment (LCA) figures in kg CO2-eq per tonne are the only apples-to-apples way to compare suppliers. Demeter Biosciences' land-based, microalgae-fed brine shrimp model is one example of a production approach designed with these metrics in mind.
Table of Contents
- What does the carbon footprint of fish feed actually measure?
- Why feed production drives aquaculture's GHG emissions
- How ingredient choice changes footprints and creates trade-offs
- How footprints are measured and why supplier numbers vary
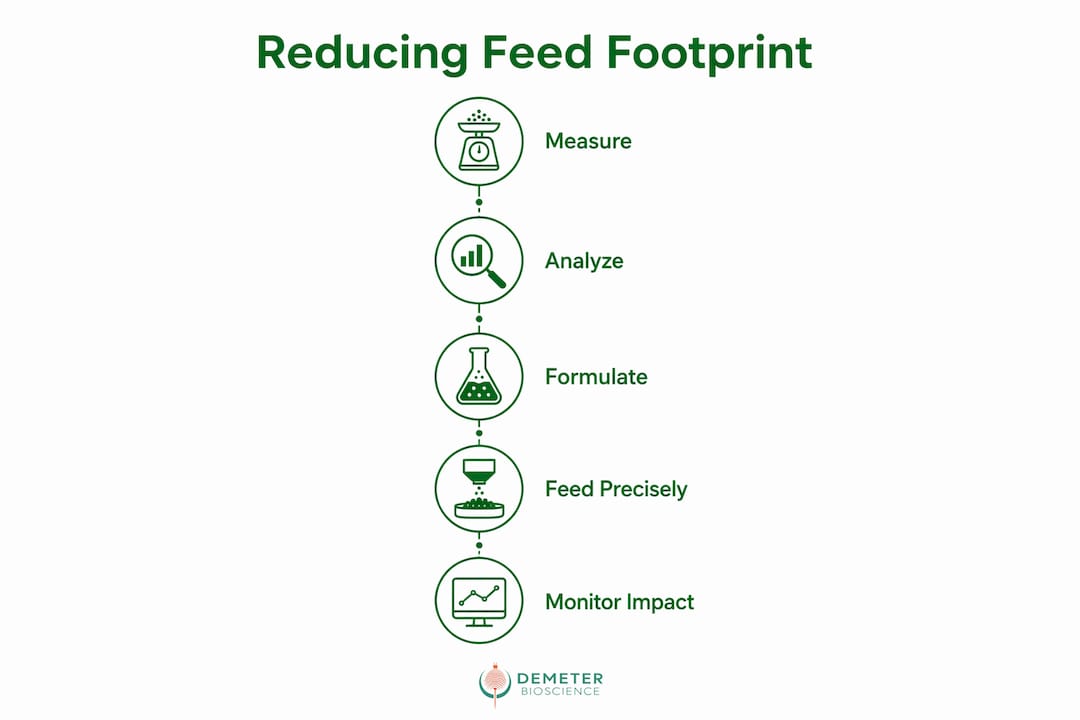
- Practical steps to lower your fish food carbon footprint
- Why farmed, microalgae-fed brine shrimp can lower your feed footprint
- Key Takeaways
- The case for farmed, algae-fed live feeds
- Demeterbioscience's live brine shrimp for lower-impact feeding
- Useful sources and further reading
What does the carbon footprint of fish feed actually measure?
The metric counts every GHG-emitting stage from raw material to the farm gate, then converts all gases to a single CO2-equivalent number. The functional unit matters enormously for comparisons: some suppliers report per kg of feed, others per tonne, and some per kg of fish produced. Those three units are not interchangeable, and mixing them is the most common mistake buyers make when comparing supplier claims.
| Lifecycle stage | What it includes | Typical GHG driver |
|---|---|---|
| Raw material production | Growing fishmeal fish, soy, algae, insects | Land-use change, fertilizer N2O, fishing energy |
| Ingredient processing | Rendering, drying, oil extraction | Fossil fuel combustion |
| Feed milling | Pelleting, extrusion, packaging | Electricity and heat |
| Transport to farm | Shipping, trucking | Fuel combustion |
| On-farm uneaten feed | Decomposition in sediment | CH4 and N2O release |
The standard industry definition: a feed's carbon footprint is the cumulative GHG emissions across its full lifecycle, reported in kg CO2-equivalents per functional unit — most commonly per tonne of feed on a cradle-to-farm-gate basis. System boundaries vary by study, so always confirm what a supplier's number actually includes before comparing it to another.
Why feed production drives aquaculture's GHG emissions
Feed provision is consistently identified as the principal GHG source in fed aquaculture systems. Global aquaculture emitted roughly 261 Mt CO2-equivalent in 2017, and feed production sits at the center of that number.
The main drivers, ranked by typical impact:
- Ingredient type and origin. Marine ingredients (fishmeal, fish oil) carry the energy cost of fishing fleets and rendering. Soy carries land-use change and fertilizer-derived N2O. Where an ingredient is grown and how it is processed often outweighs the ingredient category itself.
- Transport mode and distance. Air freight can push salmon's footprint to 14 kg CO2-eq per kg of edible product. Truck transport to European markets typically lands between 2–5 kg CO2-eq per kg.
- Feed mill energy. Extrusion and drying are energy-intensive processes, and mills using different energy sources vary in their emissions.
- Uneaten feed. Feed decomposing in pond sediment releases methane and nitrous oxide, compounding the original production footprint.
FCR is the multiplier that ties all of this together. A salmon farm running FCR 1.2 uses 20% less feed per kg of fish than one running FCR 1.5. That gap translates directly into fewer upstream emissions. Improving FCR through better feed quality and precision feeding is one of the fastest ways to cut a farm's effective carbon intensity.
Pro Tip: To estimate on-farm FCR, divide total feed fed (kg) by total fish biomass gained (kg) over the same period. For hobbyists, weigh feed portions weekly and track fish weight monthly. Even rough tracking reveals whether you are overfeeding, which is the fastest fix available.
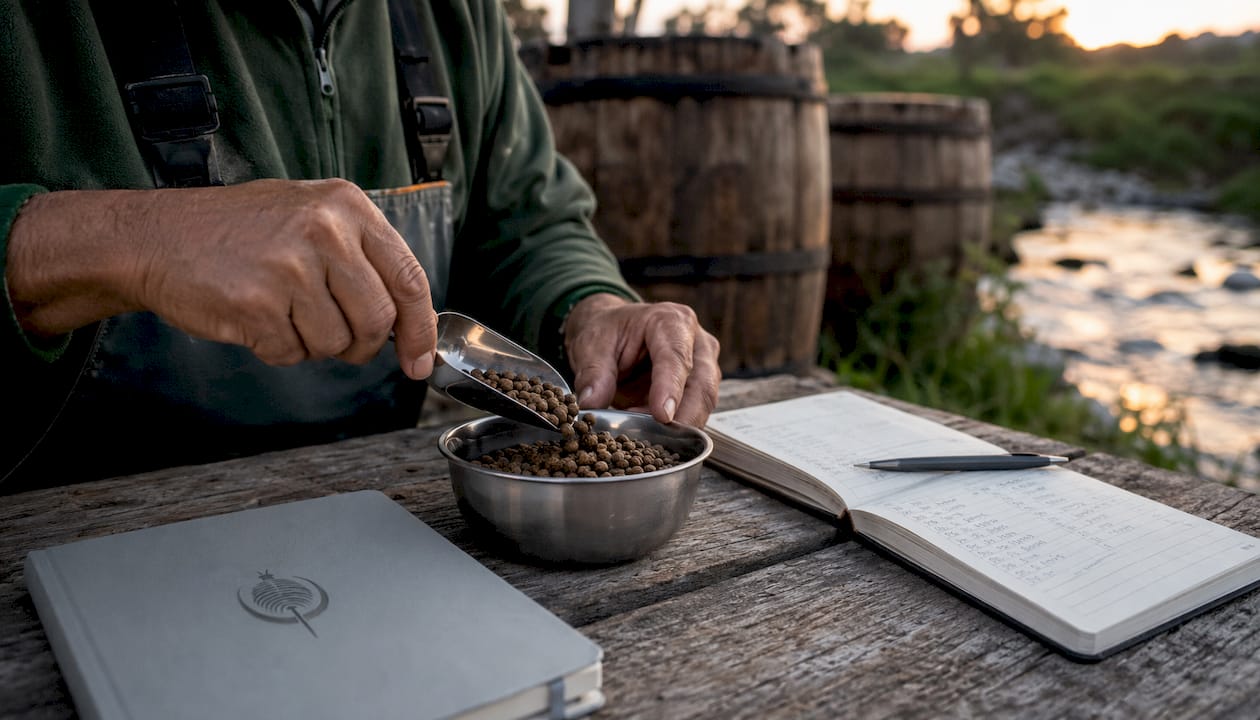
How ingredient choice changes footprints and creates trade-offs
Swapping one ingredient for another rarely solves the problem cleanly. European aquafeed data from 2000–2020 shows that reducing wild fish use in feed actually increased global warming impact and land use over that period, because soy and terrestrial crops replaced marine ingredients.
| Ingredient category | Carbon profile | Key trade-off |
|---|---|---|
| Fishmeal and fish oil typically have moderate environmental impacts related to fishing energy and processing, and carry concerns about marine resource use and bycatch | ||
| Soy and terrestrial crops generally have moderate environmental impacts but can be associated with deforestation risk and fertilizer-related emissions | ||
| Microalgae | Low when land-based, controlled | Scaling cost, energy for cultivation |
| Insect meal | Generally lower land use than soy | Supply constraints, regulatory variation |
| Marine by-products | Variable; depends on allocation method | Availability, processing energy |
Formulation adjustments toward lower-carbon sources can reduce kg CO2-eq per tonne of feed, often with only modest cost increases. The catch is that "lower carbon" on one metric can mean higher impact on another. Microalgae and insect meal can avoid many trade-offs when responsibly sourced, although they currently face constraints such as higher costs and limited verified supply at commercial scale.
How footprints are measured and why supplier numbers vary
LCA is the standard methodology, but two suppliers can report very different numbers for functionally similar feeds because they drew different system boundaries. The most common divergences:
- Cradle-to-farm-gate vs. cradle-to-retail: the latter adds processing, cold chain, and retail energy.
- Land-use change inclusion: some studies include deforestation-related CO2 for soy; others exclude it entirely.
- Allocation rules: when a fish is processed into both meal and oil, how emissions are split between the two products changes both numbers.
- Geographic origin of ingredients: spatial origin and processing choices create large footprint differences within the same ingredient category.
When you ask a supplier for carbon data, request these specifics: declared functional unit, kg CO2-eq per tonne of feed, origin of key ingredients (country and production method), whether land-use change is included, and whether the figures are third-party verified. Without those details, a low number on a spec sheet is unverifiable. For a practical sourcing checklist, the sustainable aquatic feed guide covers the full set of questions worth asking.
Practical steps to lower your fish food carbon footprint
The right moves depend on your role.
Hobbyists have the most direct control over feeding precision. Feed only what fish consume in two to three minutes, twice daily. Overfeeding is the fastest way to inflate effective footprint per fish, because uneaten feed decomposes and drives on-farm GHG. Choosing live feeds with consistent nutrition also improves FCR, meaning fish grow more from less.
Retailers should request LCA summaries, guaranteed nutritional analysis, and production method documentation from every feed supplier. A supplier who cannot provide kg CO2-eq per tonne or explain ingredient origins is not in a position to make credible sustainability claims. The environmentally responsible fish food guide outlines exactly what to look for on a label and in a supplier conversation.
Aquaculture farmers have the most levers: formulation changes, precision feeding systems, and ingredient sourcing decisions. Even modest FCR improvements compound across a production cycle. Switching to feeds with verified lower-carbon ingredients, combined with automated feeders that reduce waste, can cut effective emissions per kg of fish meaningfully.
Pro Tip: When weighing cost versus carbon for a feed switch, ask suppliers for the cost delta per tonne alongside the CO2-eq reduction. Formulation changes often raise raw material costs only a few percent for measurable footprint reductions, making the math more favorable than it first appears.
Why farmed, microalgae-fed brine shrimp can lower your feed footprint
Demeter Biosciences produces live brine shrimp in land-based systems, feeding them exclusively on Dunaliella microalgae. That controlled environment does several things that matter for carbon and nutrition simultaneously.
Consistent, land-based production means the nutritional profile does not fluctuate with seasons or wild population dynamics. Brine shrimp raised on a defined algae diet deliver at least 40% protein content reliably, which supports better FCR in the fish eating them. Better FCR means less feed required per unit of fish growth, and less feed means lower cumulative emissions across the supply chain.
Wild-harvested brine shrimp face seasonal variability and starvation conditions in natural ecosystems, which degrades nutritional quality and forces feeders to compensate with higher volumes. That volume increase directly raises the effective carbon cost per unit of fish growth. Land-based cultivation also sidesteps the logistics of wild-harvest supply chains, reducing transport-related emissions for buyers sourcing domestically in the U.S.
Microalgae-based nutrition can match or exceed traditional fishmeal protein profiles while avoiding many of the extraction and transport footprints tied to commodity feed ingredients. For hobbyists and retailers who want a live feed with a traceable, low-impact production method, farmed brine shrimp fed on microalgae represent one of the cleaner options currently available. Learn more about microalgae as fish feed and the nutritional case behind it.
Key Takeaways
Feed is the dominant source of aquaculture GHG emissions, and FCR is the single most powerful lever for reducing the carbon cost per kg of fish produced.
| Point | Details |
|---|---|
| Carbon footprint definition | Total lifecycle GHG expressed as kg CO2-eq per tonne or per kg of feed, cradle-to-farm-gate. |
| Feed dominates emissions | Feed-related activities account for 50%–80% of farm-gate GHG in many farmed species. |
| FCR is the multiplier | Improving FCR directly reduces feed consumed and therefore upstream emissions per kg of fish. |
| Sourcing origin matters | Where ingredients are grown and how they are processed often outweighs ingredient category in determining net footprint. |
| Demeterbioscience's approach | Land-based, microalgae-fed brine shrimp with at least 40% protein content supports better FCR and traceable, lower-impact sourcing. |
The case for farmed, algae-fed live feeds
The conventional framing in aquaculture sustainability tends to focus on feed formulation at the commodity scale: swap fishmeal for soy, swap soy for insect meal, and watch the numbers improve. The evidence is more complicated than that. Ingredient swaps without attention to sourcing geography and processing energy can raise total impact even while reducing one metric. And for hobbyists and small-scale retailers, the commodity feed conversation is largely irrelevant anyway.
What actually moves the needle at the individual buyer level is feeding precision and nutritional consistency. A live feed that delivers reliable protein content every shipment allows fish to grow efficiently without the compensatory overfeeding that inflates both cost and carbon. That is the practical argument for farmed, algae-fed brine shrimp, and it holds regardless of whether a buyer is running a 50-gallon display tank or supplying a regional fish store. The cost premium over wild-harvested alternatives is real, but so is the difference in nutritional predictability and the reduction in wasted feed.
Demeterbioscience's live brine shrimp for lower-impact feeding
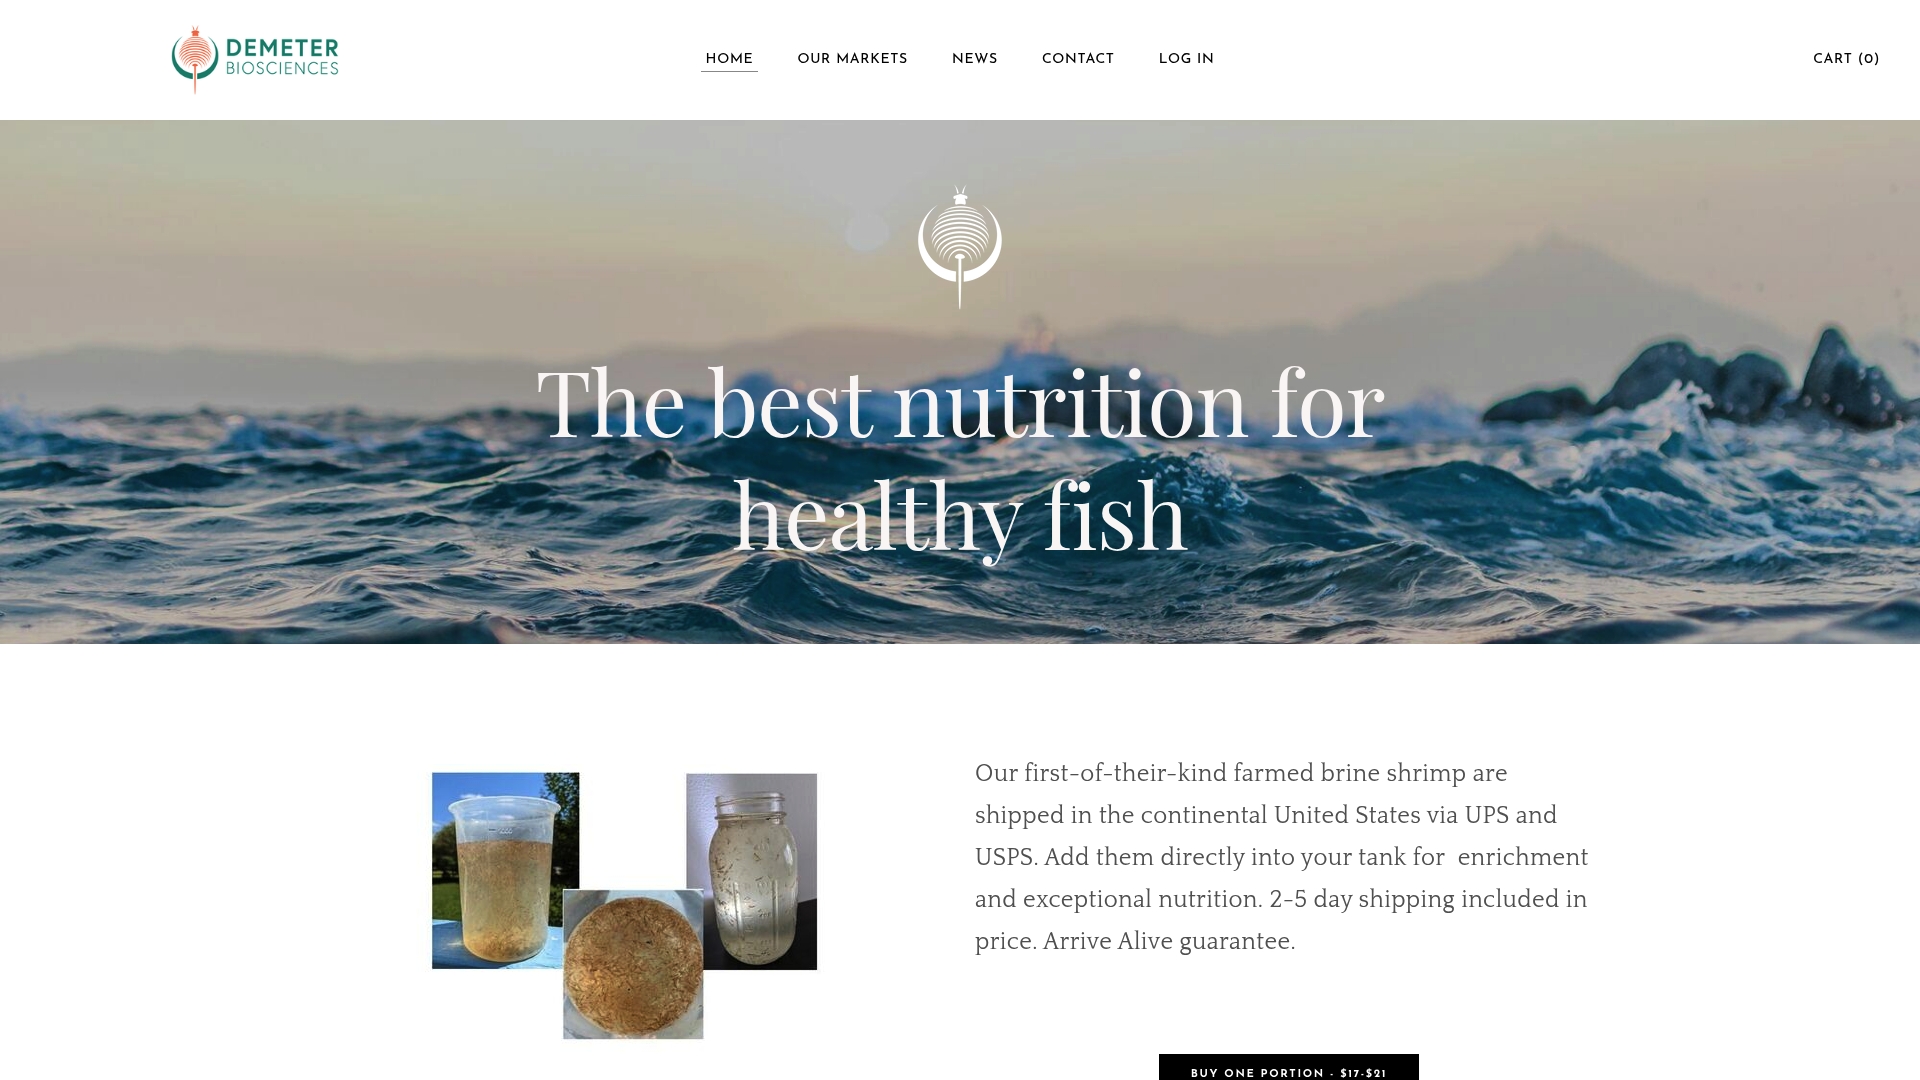
Demeterbioscience grows live brine shrimp in land-based systems fed exclusively on Dunaliella microalgae, delivering at least 40% protein content with every shipment. That consistency translates directly into better FCR for your fish and less feed waste driving on-farm emissions. Orders are available as single live brine shrimp shipments for hobbyists, monthly subscription plans for predictable recurring supply, and bulk retail packages for local fish stores, museums, and research institutions. If you want production method documentation or have questions about sourcing transparency, reach out directly at the contact page. Start with the product that fits your scale, and feed your fish something you can actually trace.
Useful sources and further reading
- Quantifying greenhouse gas emissions from global aquaculture (Scientific Reports, 2020): The primary benchmark for global aquaculture emissions (~261 Mt CO2-eq) and the 50%–80% feed contribution figure. Start here for scale context.
- Understanding and mitigating GHG emissions in aquaculture: Comprehensive species-level review covering FCR ranges, transport impacts, and mitigation pathways. Best source for species-specific footprint ranges.
- The origins of aquafeed ingredients matter more than composition (Nature Food): Key paper showing that geographic origin and processing energy outweigh ingredient category in determining net footprint. Essential for supplier evaluation.
- Sustainable aquafeed? The devil is in the detail (Kok et al.): European feed data from 2000–2020 documenting how ingredient swaps can raise global warming impact. Use for ingredient trade-off context.
- Insect proteins as sustainable feed ingredients (Discover Food): LCA comparisons of insect meal versus soy, covering land use and water efficiency. Best reference for emerging low-carbon ingredient data.
- FAO fisheries and aquaculture resources: Primary source for on-farm biological GHG (CH4 and N2O from uneaten feed decomposition) and broader aquaculture sustainability guidance.
- From Cradle to Plate: Analysing the Life Cycle Sustainability of Fish Feed Composition: Detailed LCA methodology walkthrough using PEFCR standards; useful for understanding how functional units and system boundaries are set in practice.
- ASC Aquaculture Stewardship Council: Industry definitions for feed carbon footprint reporting and certification standards relevant to U.S. buyers.
- IFFO: What drives the depth of feed footprints: Industry analysis of formulation cost versus carbon reduction trade-offs; practical for farmers evaluating ingredient switches.