

Nutritional guarantees in fish food sales are defined as the standardized minimum and maximum nutrient values printed on product labels, giving buyers a regulated baseline for comparing crude protein, fat, fiber, and moisture across products. In 2026, the role of nutritional guarantees in fish food sales extends beyond simple compliance. The FDA and state agencies oversee label claims like "organic" or "color enhancing," requiring substantiation before products reach store shelves. Fish food is mostly voluntarily compliant with AAFCO standards to support interstate commerce and consumer trust. Aquarium enthusiasts, pet retailers, and aquaculture professionals all use these guarantees as a first filter when evaluating products, though the label tells only part of the story.
What nutritional components are guaranteed and why they matter
Guaranteed analysis covers five core nutrients: crude protein, crude fat, crude fiber, moisture, and ash. Each one signals something specific about a food's formulation and its suitability for a given fish species.
Protein is the most watched number. Carnivores require 40–55% protein, herbivores need 35–45%, and omnivores fall in between. Fat supports energy and fat-soluble vitamin absorption, typically ranging from 15–25% in quality formulas. Fiber stays below 5% for most fish, since their digestive systems handle plant matter poorly compared to terrestrial animals. Moisture matters more than most buyers realize. Frozen foods contain 70–80% water, which makes their protein percentages look lower than dry pellets. Comparing a frozen food's protein to a pellet's protein without accounting for moisture produces a misleading result.
Ash content reflects the mineral load in a food, including calcium, phosphorus, and trace elements. High ash levels can indicate heavy use of bone meal or low-quality protein sources. Guaranteed analysis does not measure digestibility, amino acid profile, or carbohydrate content. Those gaps matter enormously for fish health outcomes.
| Fish type | Crude protein | Crude fat | Crude fiber | Moisture |
|---|---|---|---|---|
| Carnivore | 40–55% | 15–25% | Below 5% | Below 10% (dry) |
| Herbivore | 35–45% | 5–10% | 5–8% | Below 10% (dry) |
| Omnivore | 38–50% | 10–18% | Below 5% | Below 10% (dry) |
| Frozen (any type) | 10–20% (wet basis) | 3–8% (wet basis) | Below 2% | 70–80% |
Pro Tip: Always compare fish foods within the same format category. Frozen to frozen, pellet to pellet. Mixing formats without adjusting for moisture produces comparisons that mean nothing.
How do nutritional guarantees influence purchasing decisions?
The role of guaranteed analysis shifts depending on who is buying and why.
For aquarium enthusiasts, the protein percentage is usually the first number checked. A hobbyist keeping a reef tank with carnivorous fish will scan for a protein floor above 45% and a fat content that supports energy without fouling water. Premium labeling with marine-based ingredients, algae, vitamins, and pigments signals a food designed for health and coloration, not just caloric fill. The guarantee gives hobbyists a shortcut when comparing dozens of products on a retailer's shelf.
Pet retailers use nutritional guarantees differently. Buyers sourcing inventory look at guarantees to tier their product range: entry-level foods with lower protein floors, mid-range formulas with balanced macros, and premium lines with high protein and functional ingredients. Guaranteed analysis also protects retailers legally. Stocking a product with unsubstantiated label claims creates liability exposure under FDA oversight.
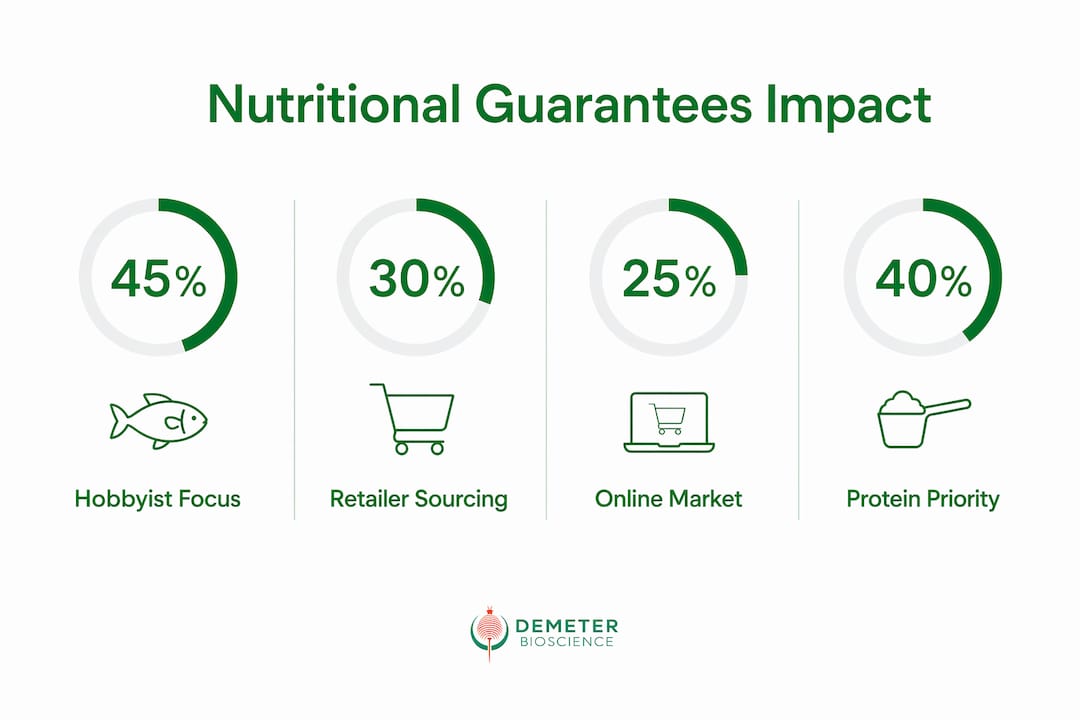
Aquaculture professionals treat guarantees as a cost-efficiency tool. Feed conversion ratio and growth rate per dollar spent matter more than brand identity. A guaranteed protein floor of 45% in a pellet tells a farm buyer the minimum they can expect from every batch. That predictability reduces financial risk across large-volume orders.
Key decision factors linked to nutritional guarantees:
- Protein floor: Sets the minimum acceptable quality threshold for species-specific diets
- Fat range: Signals energy density and suitability for growth versus maintenance feeding
- Fiber ceiling: Filters out foods with excessive plant filler for carnivorous species
- Moisture declaration: Flags format type and enables accurate cross-product comparison
- Label claim substantiation: Indicates regulatory compliance and brand credibility
- Ingredient list position: Reveals whether the guaranteed protein comes from quality sources or cheap fillers
Online retailers now capture 20–25% of US fish food market value. That shift means buyers increasingly rely on label data alone, without a store associate to explain formulations. Transparent, verified labeling has become a direct sales driver for premium brands.
Why guaranteed analysis alone is not enough
Guaranteed analysis is a regulatory minimum, not a quality certificate. Knowing that a food contains at least 45% crude protein says nothing about whether that protein is digestible or comes from a quality source.
The four most critical gaps in standard guaranteed analysis:
- Protein digestibility: A food can hit 50% crude protein using feather meal or hydrolyzed leather, both of which fish cannot absorb efficiently. Digestibility data requires lab testing beyond what labels mandate.
- Amino acid profile: Fish require specific amino acids like lysine and methionine. Guaranteed analysis does not break these down. A food deficient in lysine stunts growth even when total protein looks adequate.
- Carbohydrate content: Carbohydrate content is rarely listed on fish food labels. Quality foods range from 15–25% carbohydrates, while cheap filler-heavy formulas can exceed 40%. High carbohydrate loads stress fish livers and reduce growth efficiency.
- Contaminant limits: Heavy metals, mycotoxins, and oxidized fats do not appear on guaranteed analysis panels. Aquaculture buyers sourcing at scale need specification sheets with contaminant limits to assess true product safety.
The subtraction method gives buyers a practical workaround for the carbohydrate gap. Add up the percentages for protein, fat, fiber, moisture, and ash, then subtract from 100. The remainder estimates carbohydrate content. A food showing 45% protein, 12% fat, 3% fiber, 8% moisture, and 7% ash leaves 25% unaccounted, which is a reasonable carbohydrate level. A food where that remainder exceeds 40% is almost certainly built on grain fillers.
Real-world consequences of relying solely on guaranteed analysis show up in fish health. A captive fish nutritional protocol that ignores digestibility can produce stunted growth, poor coloration, and immune suppression even when label numbers look acceptable. Retailers who educate buyers on reading beyond the guarantee reduce returns and build long-term customer loyalty.
Pro Tip: Always read the ingredient list alongside the guaranteed analysis. If the first three ingredients are corn, wheat, or soy, the protein percentage is likely coming from plant sources with lower bioavailability for carnivorous fish.
What emerging practices are raising the bar beyond guarantees?
The fish food industry is moving toward transparency tools that make guaranteed analysis a starting point, not an endpoint. Several practices are reshaping how products are sold and evaluated.
- QR codes linked to batch-specific lab reports: AI automation linking QR codes to lab reports cuts manual listing time by 70% and increases average order value. Buyers scan a code on the bag and see the actual protein digestibility, amino acid breakdown, and contaminant results for that production batch.
- Marine Stewardship Council certification: MSC certification signals that fish meal ingredients come from sustainably managed fisheries. For retailers and aquaculture buyers, this certification reduces supply chain risk and supports sustainable fish food positioning.
- Technical service marketing: Mobile diagnostics and pond-side seminars build trust with industrial aquaculture buyers more effectively than slogans. Showing a feed's performance in a buyer's own production environment closes sales faster than any label claim.
- Performance benchmarking: Aquaculture sales teams that present feed conversion ratio data from controlled trials give buyers a financial argument, not just a nutritional one. Direct-to-farm models using this approach reduce sales cycles by up to 3 days.
- Functional ingredient claims: Industry trends show increased demand for immune support, sustainable sourcing, and ingredient transparency in fish feed. Brands that substantiate these claims with lab data convert at higher rates than those relying on marketing language alone.
"Transparency is the new premium. Buyers who can verify what they are feeding their fish do not need to be sold to. They sell themselves."
This shift benefits every buyer segment. Hobbyists get confidence. Retailers get defensible sourcing decisions. Aquaculture professionals get financial accountability. The brands that invest in verified transparency are the ones capturing the premium tier of the market.
Key Takeaways
Nutritional guarantees set the regulatory floor for fish food quality, but verified transparency across digestibility, ingredient sourcing, and carbohydrate content is what separates good products from great ones.
| Point | Details |
|---|---|
| Guaranteed analysis is a baseline | It shows minimum protein, fat, fiber, and moisture, not digestibility or ingredient quality. |
| Format affects protein comparison | Frozen foods contain 70–80% water, so compare within the same food format for accuracy. |
| Carbohydrate gap is real | Use the subtraction method to estimate carbohydrate content; quality foods stay below 25%. |
| Transparency drives premium sales | QR codes linked to lab reports and MSC certification are replacing label claims as trust signals. |
| Ingredient list completes the picture | The first three ingredients reveal whether guaranteed protein comes from quality or filler sources. |
Why I think most buyers are using guarantees wrong
Most buyers treat guaranteed analysis like a finish line. They find a food with 45% protein, check the box, and move on. That approach produces mediocre results, and I have seen it play out repeatedly across both hobbyist and professional contexts.
The guarantee tells you the floor. It does not tell you what the building is made of. A food hitting 50% crude protein with feather meal as the primary source will underperform a food at 42% protein built on whole fish meal and algae. The fish knows the difference even when the label does not show it.
What actually works is treating the guaranteed analysis as the entry ticket, not the evaluation. Use it to eliminate obvious low-quality products, then go deeper. Check the ingredient list. Ask for digestibility data. Look for batch-specific lab reports. Demand MSC or equivalent certification for marine ingredients. For live foods, the nutritional value in fish food comes from what the food source itself was fed, which is something no dry food label can replicate.
The buyers who get the best fish health outcomes are the ones who treat nutritional guarantees as a starting point and build their evaluation from there. That is not a complicated shift. It just requires knowing what questions to ask.
— Demeter
Demeterbioscience's approach to verified fish nutrition
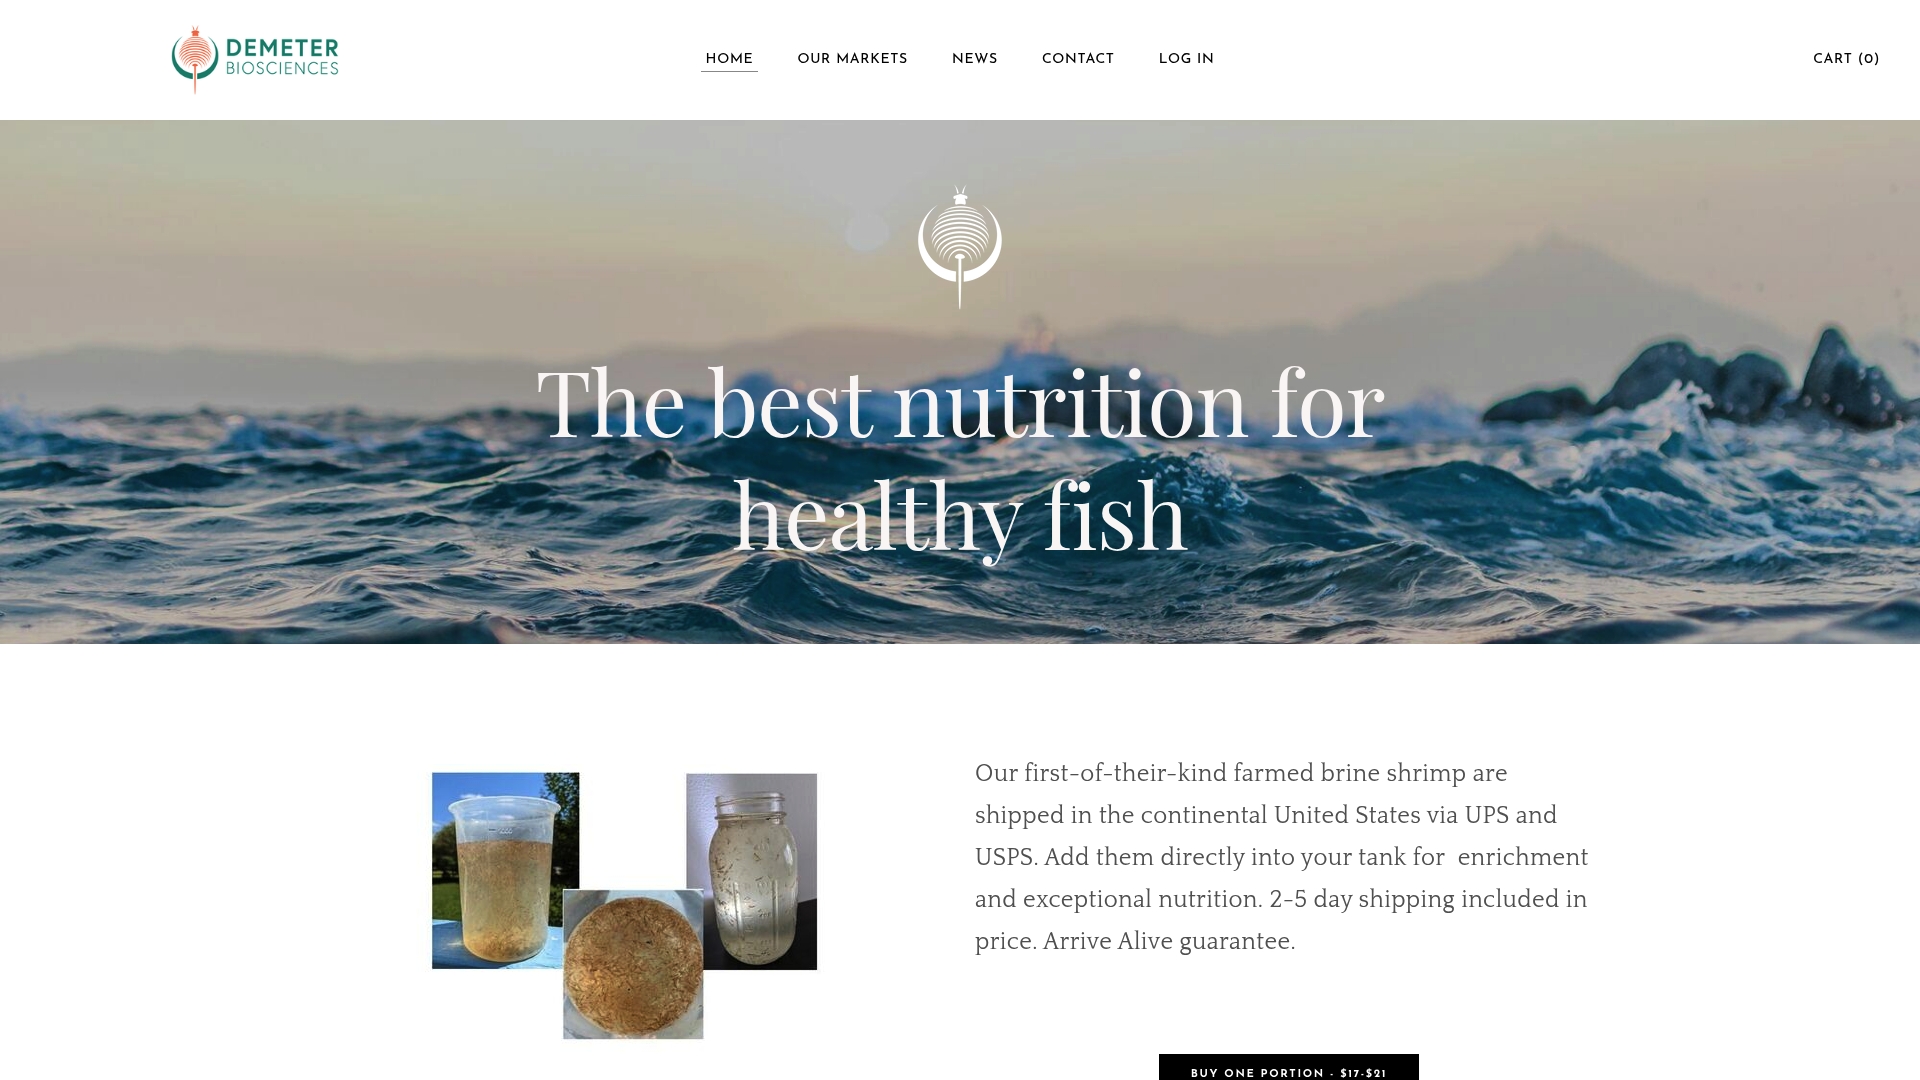
Demeterbioscience produces live brine shrimp fed exclusively on the microalgae Dunaliella, guaranteeing at least 40% protein content with consistent nutritional quality across every batch. Unlike wild-harvested brine shrimp, which suffer from seasonal variability and starvation conditions in natural ecosystems, Demeterbioscience's land-based cultivation system delivers a product with verified, stable nutrition. For aquarium enthusiasts, pet retailers, and aquaculture professionals who want a live food that goes beyond label minimums, live brine shrimp from Demeterbioscience offer direct-to-consumer shipments, monthly subscription plans, and bulk retail packages. The nutritional consistency is built into the production system, not printed as a claim.
FAQ
What is guaranteed analysis in fish food?
Guaranteed analysis is the regulated label panel showing minimum crude protein, minimum crude fat, maximum crude fiber, and maximum moisture content. It gives buyers a standardized baseline for comparing products but does not measure digestibility or ingredient quality.
How do I calculate carbohydrate content in fish food?
Subtract the sum of protein, fat, fiber, moisture, and ash percentages from 100. The remainder estimates carbohydrate content. Quality fish foods stay in the 15–25% range; values above 40% indicate heavy grain filler use.
Why does frozen fish food show lower protein than dry food?
Frozen fish foods contain 70–80% water, which dilutes the protein percentage on a wet-weight basis. Always compare frozen foods to other frozen foods and dry pellets to other dry pellets for an accurate nutritional picture.
Do fish food labels in the US have to meet AAFCO standards?
Fish food is not strictly required to meet AAFCO standards, but most brands voluntarily comply to support interstate commerce and consumer trust. The FDA and state agencies oversee label claims and require substantiation for terms like "organic" or "color enhancing."
What should I look for beyond the guaranteed analysis?
Check the ingredient list for named protein sources in the first three positions, ask for digestibility data or batch-specific lab reports, and look for certifications like Marine Stewardship Council for sustainable sourcing. For live foods, the nutritional quality of the food source itself is the most reliable indicator.