
Aquaculture's environmental footprint is a multi-indicator, life-cycle measure of the pressures fish and shellfish farming places on climate, water, nutrients, and energy systems, expressed against a defined functional unit such as one kilogram of edible weight produced. Two hotspots dominate nearly every credible assessment: feed production and on-farm energy use. Together they drive global warming potential (GWP), eutrophication, and resource depletion across virtually all farmed species and systems. Global aquaculture contributed a measurable quantity of CO2-equivalent emissions in recent assessments, representing approximately 0.49% of anthropogenic greenhouse gas (GHG) emissions. That share is modest compared to livestock, but the impacts are concentrated and highly manageable through targeted interventions.
Three institutional anchors frame how this footprint is assessed and governed in the United States:
- FAO compiles global production statistics and publishes major LCA-informed reviews that establish baseline data for cross-country comparison.
- IPCC emission-accounting frameworks provide the GHG methodology that underpins GWP calculations in aquaculture life cycle assessments (LCAs).
- NOAA Fisheries regulates U.S. marine aquaculture and frames environmental performance as a function of management and siting rather than an inherent property of the industry.
Understanding these three pillars, and knowing how methodological choices can shift reported numbers by an order of magnitude, is the starting point for any serious policy or research engagement with aquaculture sustainability.
Table of Contents
- What does "aquaculture environmental footprint" actually mean?
- How do researchers measure aquaculture's environmental footprint?
- Which impact categories and hotspots matter most?
- How do species and production systems change the footprint profile?
- What does the U.S. regulatory framework require from aquaculture operators?
- What strategies most effectively reduce aquaculture's environmental footprint?
- How do LCA methodological choices change results, and what should reports include?
- Where are the biggest data gaps in aquaculture footprinting?
- Demeterbioscience's microalgae-fed brine shrimp as a case study in feed footprint reduction
- What do major LCA and FEWC studies tell us, and how do they apply to the U.S.?
- What policy actions should U.S. federal and state decision-makers prioritize?
- Key Takeaways
- The case for demanding more from footprint claims
- Demeterbioscience's live brine shrimp as a lower-impact feed input
- Useful sources
What does "aquaculture environmental footprint" actually mean?
The term borrows from industrial ecology. An environmental footprint is not a single number; it is a profile of impact indicators, each quantified per unit of output, across the full life cycle of a production system. For aquaculture, the most widely used conceptual frame is the FEWC nexus: the interacting flows of Food output, Energy inputs, freshwater (Water) use, and Carbon emissions.
Think of it as a flow diagram. Feed ingredients enter the farm carrying embedded land use, water, and GHG emissions from their own production. On the farm, energy drives aeration, pumping, heating, and lighting. Animals convert feed into biomass while releasing nitrogen, phosphorus, and organic matter into surrounding water bodies. Harvested product then moves through processing and distribution, adding further energy and packaging burdens before reaching the consumer.
Standard impact categories reported in aquaculture LCAs include:
- Global warming potential (GWP), measured in kg CO2-equivalent per kg product
- Eutrophication potential, measured in kg phosphate-equivalent or kg nitrogen-equivalent
- Water use, measured in liters or cubic meters per kg product (consumptive or total)
- Acidification potential, measured in kg SO2-equivalent
- Cumulative energy demand, measured in megajoules per kg product
- Land use, measured in square meters per year per kg product
The choice of functional unit matters enormously for comparability. Reporting per kilogram of live weight, per kilogram of edible weight, or per kilogram of protein yields very different numbers for the same system, particularly for species with low fillet yields. A salmon with a 60% fillet yield looks considerably worse on a per-kilogram-edible-weight basis than on a live-weight basis. Analysts comparing studies across species must verify that functional units align before drawing conclusions.
A 2018 FEWC composite assessment of global aquaculture estimated total energy use at approximately 1,765.2 × 10³ TJ, freshwater consumption at 122.6 km³, and GHG emissions at 261.3 million tonnes CO2-equivalent, with China, India, and Indonesia accounting for the largest national shares. Those numbers set the scale against which any national or farm-level footprint should be interpreted.
How do researchers measure aquaculture's environmental footprint?
Four methods dominate the literature, each with distinct strengths and blind spots.

Attributional LCA (ISO 14040/14044)
This is the workhorse of aquaculture footprinting. Attributional LCA maps physical flows of materials and energy through a defined system boundary and allocates environmental burdens to the functional unit. It answers the question: "What share of global environmental burden is attributable to producing one kilogram of this product?" It is well-suited to product benchmarking and eco-labeling. The limitation is that it does not capture market-mediated effects — it cannot tell you what happens to soy demand if fishmeal is replaced.
Consequential LCA
Consequential LCA models the marginal effects of a decision on the broader economic system. It is the right tool for policy questions like "What happens to total GHG emissions if U.S. shrimp imports are substituted with domestic RAS production?" It requires economic modeling assumptions that introduce significant uncertainty, which is why it appears less frequently in peer-reviewed aquaculture studies but is increasingly demanded by policymakers.
Environmentally extended input–output (EEIO) analysis
EEIO uses national economic accounts linked to environmental satellite data to estimate the footprint of entire sectors. It captures upstream supply-chain effects that process-level LCA often misses, but at the cost of spatial and species-level resolution. Useful for national policy and trade analysis; less useful for farm-level benchmarking.
IPCC-compliant GHG accounting
The IPCC Tier 1–3 framework provides standardized emission factors for on-farm energy use, feed production, and enteric processes. It is the basis for national GHG inventories and mandatory for any reporting that feeds into international climate commitments. Aquaculture-specific emission factors remain less developed than those for livestock, which is itself a research gap.
LCA methodology reviews confirm that differences in functional units, system boundaries, and allocation methods are the primary obstacle to cross-study comparability and, by extension, to policy translation. The table below maps each method to its typical use case.
| Method | Typical functional unit | Main uncertainties | Best-use scenario |
|---|---|---|---|
| Attributional LCA | kg edible weight or live weight | Feed ingredient data quality; co-product allocation | Product benchmarking, eco-labels, farm comparison |
| Consequential LCA | kg product or tonne sector output | Market modeling assumptions; substitution elasticities | Policy scenario analysis, substitution decisions |
| EEIO analysis | $ sector output or tonne production | Sector aggregation; spatial averaging | National footprint estimates, trade analysis |
| IPCC GHG accounting | tonne CO2e per tonne production | Aquaculture-specific emission factors underdeveloped | National inventories, climate reporting |
Allocation is where studies diverge most sharply. When a salmon processing plant produces fillets, heads, frames, and oil, how much of the farm's GHG burden belongs to each co-product? Mass allocation, economic allocation, and protein-content allocation can shift the fillet's footprint by 30–50% relative to each other. There is no universally correct answer, but the choice must be stated and justified.
Pro Tip: When reading or commissioning an LCA, check three things before trusting the headline number: the functional unit, the system boundary (cradle-to-farm-gate vs. cradle-to-retail), and how co-products are handled. If the study does not report a sensitivity analysis on allocation method, treat the result as directional only.
Which impact categories and hotspots matter most?
Feed production and on-farm energy are the dominant drivers of GWP, eutrophication, and water acidification across aquaculture systems, a finding that holds across species, geographies, and production systems with remarkable consistency. The ranking of impact categories by typical importance in aquaculture LCAs runs roughly as follows: GWP first, eutrophication potential second, energy demand third, water use fourth, acidification fifth, and land use and biodiversity pressures sixth. The last two are the least standardized and the most contested methodologically.

Feed production dominates GWP for two reasons. First, feed ingredients, particularly fishmeal, soy, and corn, carry large embedded GHG burdens from their own production, including land-use change (LUC) emissions that are often excluded from LCA system boundaries but can dwarf on-farm emissions when included. Second, the feed conversion ratio (FCR) acts as a multiplier: a system with an FCR of 2.0 uses twice the feed per kilogram of gain as one with an FCR of 1.0, and every unit of feed carries its full upstream burden.
Nutrient discharges are the primary eutrophication risk. Uneaten feed and feces release nitrogen and phosphorus directly into receiving water bodies in open systems. Fed aquaculture feed production has increased substantially over the past decade, and without mitigation, the associated water footprint is projected to roughly double by mid-century. In closed systems like recirculating aquaculture systems (RAS), nutrient discharge is captured but the treatment of that waste stream becomes its own environmental burden.
On-farm energy use is the second major GWP driver, particularly for RAS, biofloc, and heated pond systems. The carbon intensity of the local electricity grid determines whether high-energy systems are net better or worse than open systems on a GWP basis. A RAS powered by Pacific Northwest hydroelectricity has a fundamentally different carbon profile than the same system running on a coal-heavy Midwest grid.
How do species and production systems change the footprint profile?
Heterogeneity is the defining feature of aquaculture's environmental footprint. A blanket statement that "aquaculture is sustainable" or "aquaculture is harmful" is analytically meaningless without specifying species and system. A global assessment confirms that bivalves and seaweeds carry the lowest environmental impacts across metrics, while carnivorous finfish and shrimp sit at the high end.
Key contrasts by species:
- Bivalves (oysters, mussels, clams): No feed inputs, filter ambient phytoplankton, and can actively sequester carbon and nitrogen from the water column. GWP per kilogram of edible weight is among the lowest of any animal protein. The primary environmental concerns are siting (habitat displacement) and disease management.
- Seaweeds: Similar logic. No feed, no fertilizer in most systems, and potential for carbon sequestration. Footprint is dominated by harvest, drying, and transport energy.
- Omnivorous and herbivorous finfish (tilapia, carp, catfish): Moderate FCRs, often raised in extensive or semi-intensive ponds. Feed-related GWP is lower than for carnivorous species, but pond effluent can be significant in high-density systems.
- Carnivorous finfish (salmon, trout, sea bass): Higher FCRs and greater dependence on fishmeal and fish oil drive elevated GWP and acidification. Atlantic salmon LCAs typically report GWP in the range of several kilograms of CO2-equivalent per kilogram of live weight, with feed accounting for the majority of that burden.
- Shrimp: High FCRs, intensive pond systems with significant effluent loads, and historical association with mangrove conversion make shrimp among the highest-footprint species per kilogram of edible weight.
System differences shift the hotspot profile rather than simply raising or lowering the total:
- Extensive ponds and cages: Lower energy demand but higher effluent risk and greater sensitivity to siting decisions. Footprint is dominated by feed and, for coastal systems, land-use change.
- RAS and biofloc: Closed-loop systems can reduce water use dramatically compared to flow-through systems, but electricity demand rises sharply. Net GHG benefit depends entirely on the carbon intensity of the local grid.
- IMTA (Integrated Multi-Trophic Aquaculture): Co-locates fed species with extractive species (bivalves, seaweeds) that absorb excess nutrients. Reduces eutrophication potential and can improve the composite footprint of the fed species by crediting the extractive species with nutrient removal.
What does the U.S. regulatory framework require from aquaculture operators?
NOAA Fisheries frames aquaculture's environmental performance as contingent on management and siting rather than as an inherently destructive activity, which is the correct framing for a governance system built around adaptive management. Federal authority over marine aquaculture flows primarily through NOAA under the Magnuson-Stevens Fishery Conservation and Management Act, with additional authority from the Army Corps of Engineers for structure permitting and the EPA for water quality.
The EPA's Clean Water Act (CWA) is the central instrument for effluent control. Concentrated Aquatic Animal Production (CAAP) facilities above defined production thresholds must obtain National Pollutant Discharge Elimination System (NPDES) permits, which set effluent limits for total suspended solids, biochemical oxygen demand, and in some cases nutrients. State environmental agencies administer NPDES permits in most states, creating significant variation in monitoring requirements and effluent standards across jurisdictions.
State permitting adds another layer. Coastal states like Maine, Washington, and California each maintain their own leasing and environmental review processes for marine aquaculture, and freshwater aquaculture is regulated almost entirely at the state level. This fragmentation means that a farm in Maine and a comparable farm in Louisiana may face very different monitoring obligations, making cross-state footprint comparisons difficult without harmonizing the underlying data.
The gap that matters most for researchers and policymakers: there is no national mandate requiring aquaculture operators to report LCA-based environmental footprints, and no federal database aggregating farm-level energy use, feed consumption, or nutrient discharge data in a form suitable for LCA. NOAA's annual fisheries statistics capture production volumes but not the input data needed to compute footprints. This absence is a structural barrier to evidence-based national policy.
What strategies most effectively reduce aquaculture's environmental footprint?
The evidence points to a clear priority order: address feed first, then energy, then effluent management, then supply-chain governance. The reasoning is straightforward. Feed dominates the footprint of most fed species, and feed-related impacts compound through the FCR multiplier. A 10% improvement in FCR reduces feed use, nutrient discharge, and upstream GHG burden simultaneously.
Feed-focused measures include:
- Alternative proteins: Microalgae, insect meal (black soldier fly), single-cell proteins, and fermented plant proteins can partially or fully replace fishmeal in many diets, reducing both GWP and pressure on wild fish stocks. Microalgae-based feeds also offer advantages in fatty acid profiles relevant to human nutrition.
- Reduced fishmeal and fish oil inclusion: Selective breeding for feed efficiency and advances in pellet technology have steadily lowered FCRs in salmon and trout farming over the past two decades.
- Precision feeding: Automated feeders with underwater cameras and AI-assisted feed detection reduce uneaten feed, the single largest source of on-farm nutrient discharge.
IMTA and circular-economy approaches appear repeatedly in the literature as integrated pathways that simultaneously reduce feed-driven impacts and improve nutrient management. Pairing salmon cages with mussel lines and kelp cultivation is the most studied configuration, with demonstrated reductions in dissolved inorganic nitrogen and phosphorus in the immediate farm environment.
System and on-farm measures beyond IMTA include solid-waste capture (drum filters, settling ponds), biogas recovery from sludge, and energy-efficiency retrofits for RAS (heat exchangers, variable-speed drives, LED lighting). For RAS operators, switching to renewable electricity contracts is the single highest-leverage GHG reduction available without changing production practices.
The table below summarizes the main mitigation levers with directional magnitude and key trade-offs.
| Mitigation option | Primary metric reduced | Directional magnitude | Key trade-offs |
|---|---|---|---|
| Alternative protein feeds (microalgae, insect meal) | GWP, land use, acidification | Moderate to large | Cost premium; palatability and FCR effects vary by species |
| Improved FCR (breeding, pellet quality, precision feeding) | GWP, eutrophication, water use | Large | Requires investment in genetics programs or feeding technology |
| IMTA (bivalves + seaweeds co-located with fed species) | Eutrophication, GWP (system level) | Moderate | Operational complexity; species compatibility constraints |
| RAS with renewable electricity | GWP, water use | Large for water; GWP depends on grid | High capital cost; electricity reliability risk |
| Solid-waste capture and biogas recovery | Eutrophication, GWP | Moderate | Infrastructure cost; sludge disposal logistics |
| Feed certification and procurement standards | GWP, land use (supply chain) | Moderate | Requires supply-chain transparency; verification costs |
Pro Tip: For finfish systems, prioritize feed-related interventions first. But pair any feed reformulation with local effluent controls. Switching from fishmeal to soy without improving nutrient management can shift the impact from ocean acidification to freshwater eutrophication, trading one problem for another.
For a practical overview of how feed sourcing criteria translate to buyer decisions, the environmentally responsible fish food guide covers the key evaluation criteria in accessible terms.
How do LCA methodological choices change results, and what should reports include?
The most sensitive modeling choices in aquaculture LCA are, in rough order of impact: functional unit, system boundary, allocation method for co-products, treatment of land-use change in feed ingredients, and spatial and temporal averaging of background data. A study that includes LUC emissions for soy-based feed can report GWP values two to three times higher than an otherwise identical study that excludes LUC. Neither is wrong in principle; they answer different questions. But if a policymaker compares the two without knowing this, they will draw incorrect conclusions.
Methodological variability in functional units, boundaries, and allocation is the primary obstacle to cross-study comparability and policy translation. Sensitivity analyses and uncertainty reporting are the tools that make LCA outputs trustworthy. Monte Carlo simulation, which propagates uncertainty through the full inventory, is the gold standard. Scenario analysis, testing how results change under alternative allocation rules or feed-ingredient assumptions, is the minimum acceptable standard for policy-relevant work.
A practical reporting checklist for researchers, funders, and reviewers:
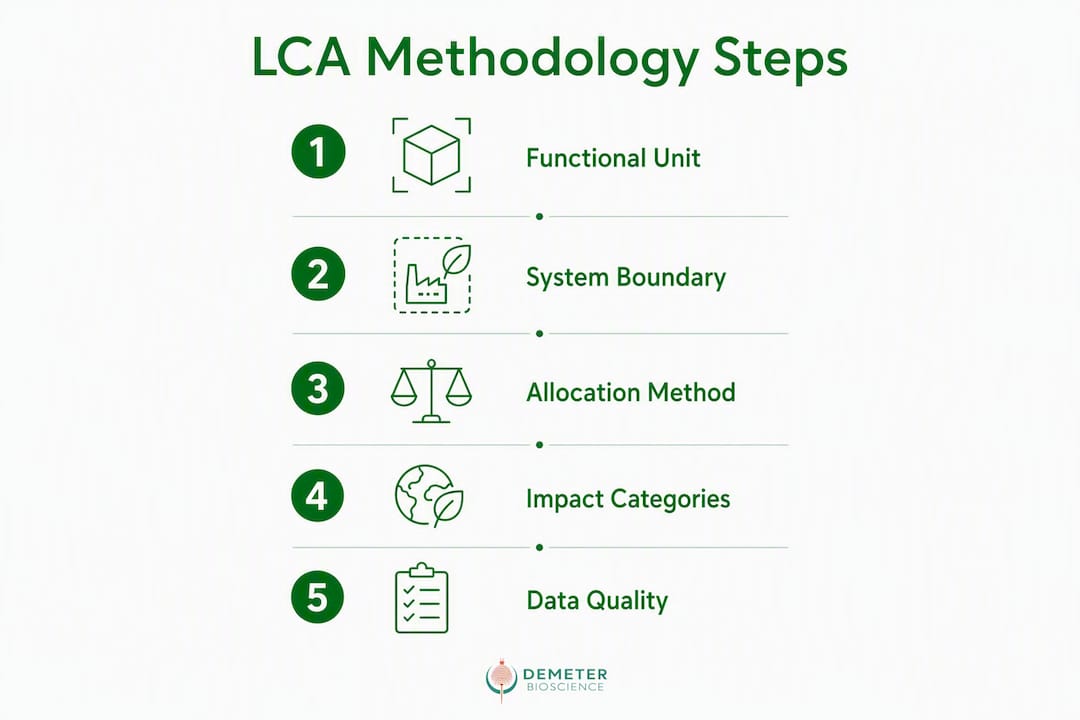
- Functional unit: stated explicitly with justification (live weight, edible weight, or protein content).
- System boundary: cradle-to-farm-gate, cradle-to-retail, or full supply chain, with a clear diagram.
- Allocation method: stated and justified; sensitivity test with at least one alternative method.
- Feed ingredient inventory: sourcing geography, LUC treatment, and data vintage stated.
- Data quality statement: primary vs. secondary data, data age, and geographic representativeness.
- Sensitivity and uncertainty results: Monte Carlo or scenario analysis reported alongside central estimates.
- Comparability note: explicit statement of what the results can and cannot be compared to.
This checklist is not bureaucratic overhead. Without it, a well-intentioned LCA can be weaponized selectively by advocates on either side of a policy debate.
Where are the biggest data gaps in aquaculture footprinting?
The evidence base for aquaculture LCA has grown substantially over the past decade, but several gaps remain large enough to materially affect policy decisions.
High-priority data gaps:
- Feed ingredient provenance and LUC emissions: Most LCAs use generic, region-averaged emission factors for soy, corn, and fishmeal. Farm-specific sourcing data linked to satellite-derived LUC estimates would dramatically improve accuracy, particularly for South American soy and Southeast Asian fishmeal.
- Standardized FCR and on-farm energy datasets by system type: Published FCR ranges for the same species in the same system type can vary by a factor of two or more across studies, reflecting genuine operational variation but also inconsistent measurement protocols. A national database of verified FCR and energy-use data, disaggregated by species and system, does not exist for U.S. aquaculture.
- Regional nutrient fate models: Eutrophication potential in LCA is typically calculated using generic characterization factors that do not reflect local hydrology, receiving water sensitivity, or seasonal dynamics. A farm discharging into a nutrient-sensitive estuary has a very different real-world impact than one discharging into a high-flushing coastal environment, but standard LCA treats them identically.
- Biodiversity impact metrics: No standardized, widely adopted method exists for quantifying aquaculture's effects on local biodiversity within an LCA framework. Habitat displacement, disease transmission to wild populations, and genetic interactions with escaped fish are real impacts that current footprint metrics largely miss.
- Dynamic LCA for multi-year systems: Salmon and other multi-year species experience fallowing cycles, disease events, and feed-formula changes over their production cycle. Static, snapshot LCAs miss the temporal dynamics that determine actual environmental outcomes.
Priority research investments for U.S. funders: first, build a standardized feed-inventory database linked to U.S. production systems; second, validate RAS energy profiles across U.S. climate zones (a RAS in Minnesota has a very different heating burden than one in Florida); third, develop and validate regional nutrient fate characterization factors for major U.S. aquaculture regions.
Demeterbioscience's microalgae-fed brine shrimp as a case study in feed footprint reduction
Demeterbioscience produces live brine shrimp (Artemia sp.) in land-based, controlled cultivation systems fed exclusively on Dunaliella microalgae. The product delivers at least 40% protein content and a consistent nutritional profile, addressing two of the most common criticisms of wild-harvested brine shrimp: seasonal variability in nutritional quality and starvation-induced nutrient depletion during holding and transport.
From a footprint perspective, the cultivation model has several hypothesized advantages worth examining systematically. The feed input is a single, cultivated microalgae species rather than a complex, multi-ingredient compound feed, which simplifies the upstream inventory considerably. Land-based production eliminates the siting and effluent risks associated with open-water or pond systems. Controlled conditions allow precise feeding management, which should translate to lower FCRs and reduced nutrient discharge compared to wild-harvest or less-controlled cultivation.
What data should an analyst request to evaluate these claims rigorously?
- Feed inventory: Dunaliella cultivation inputs (light energy source, water use, nutrient inputs, CO2 source), with geographic specificity.
- On-farm energy use: Total electricity consumption per kilogram of brine shrimp produced, with the carbon intensity of the local grid.
- Protein content verification: Third-party proximate analysis data, not just manufacturer-stated values.
- FCR impact in target diets: When brine shrimp replace a portion of compound feed in a finfish diet, what is the net effect on the diet's FCR and nutrient profile?
- Transport logistics: Shipping distance and method for live product, since live animal transport has a disproportionately high energy intensity per kilogram.
- System boundary: Does the stated footprint include the Dunaliella cultivation stage, or only the brine shrimp grow-out?
Pro Tip: When evaluating any vendor's sustainability claim for a live feed product, ask for the full inventory boundary diagram before accepting a headline GWP number. A product that looks clean at the farm gate may carry significant upstream burdens from its feed inputs or significant downstream burdens from refrigerated live shipping.
The microalgae as fish feed resource from Demeterbioscience explains the nutritional rationale for Dunaliella-based cultivation and provides a starting point for researchers evaluating the product's fit in low-impact feed strategies.
What do major LCA and FEWC studies tell us, and how do they apply to the U.S.?
The peer-reviewed literature on aquaculture footprinting has produced a set of findings that are robust enough to inform policy, even if the precise numbers vary by study.
Aquaculture contributed a measurable amount of CO2-equivalent GHG emissions in recent assessments, representing roughly 0.49% of global anthropogenic emissions. That figure covers aquatic animals only and excludes seaweeds. For context, global livestock agriculture accounts for roughly 14.5% of anthropogenic GHGs according to FAO estimates, making aquaculture's climate contribution modest in aggregate but concentrated in specific hotspots.
The FEWC composite index applied at country scale reveals that global aquaculture in 2018 consumed significant amounts of energy and freshwater, while emitting substantial CO2-equivalent emissions. China, India, and Indonesia dominate these totals by production volume. U.S. aquaculture is a small fraction of global output, but the U.S. is a major importer of aquaculture products, meaning that a significant share of the environmental footprint associated with American seafood consumption occurs in other countries.
| Study / metric | Species / system | Key finding | U.S. relevance |
|---|---|---|---|
| Global GHG (2017, Scientific Reports) | All aquatic animals | ~263 Mt CO2e; ~0.49% of anthropogenic GHGs | Contextualizes U.S. import footprint |
| FEWC composite index (2018, ScienceDirect) | All global aquaculture | 1,765.2 × 10³ TJ energy; 122.6 km³ water | Benchmarks national vs. global intensity |
| LCA review (Fishery Technology) | Multiple species/systems | Functional unit and allocation drive most cross-study variance | Guides U.S. reporting standard design |
| Bivalve/seaweed assessment (Comm. Earth & Env.) | Bivalves, seaweeds | Lowest environmental impacts; higher culture correlates with better sustainability scores | Supports U.S. shellfish expansion policy |
| RAS/biofloc trade-off (Nature Communications) | Finfish in closed systems | Water use significantly reduced; GHG depends on grid mix | Critical for U.S. inland RAS investment decisions |
Applying global averages to U.S. systems requires caution. U.S. salmon production is concentrated in the Pacific Northwest and Alaska, where grid electricity is relatively low-carbon. U.S. shrimp farming is minimal domestically; most shrimp consumed in the U.S. is imported from Southeast Asia and Latin America, where production systems and regulatory contexts differ substantially. Researchers using global LCA averages to inform U.S. domestic policy should explicitly adjust for U.S.-specific energy mix, feed sourcing, and regulatory requirements rather than applying global emission factors directly.
What policy actions should U.S. federal and state decision-makers prioritize?
The evidence base supports a tiered set of recommendations organized by time horizon.
Short-term (1–3 years): The most urgent gap is data infrastructure. NOAA and USDA should jointly fund development of a national aquaculture feed-inventory database that captures feed ingredient sourcing, FCR by species and system, and on-farm energy use. This database is a prerequisite for any credible national footprint assessment. Simultaneously, federal grant programs for aquaculture research and development should require LCA reporting using a standardized methodology, including the seven-item checklist described in the methodological guidance section above. Demonstration projects for IMTA and energy-efficient RAS in multiple U.S. climate zones would generate the system-specific data currently missing from the literature.
Medium-term (3–7 years): Federal seafood procurement standards, which already exist for domestic preference, should be extended to include environmental footprint criteria. This creates a market signal that rewards low-impact producers without requiring new regulatory authority. Incentive programs for renewable energy adoption on aquaculture farms, modeled on existing USDA Rural Energy for America Program (REAP) grants, should be explicitly extended to aquaculture operators. Regional nutrient fate modeling, developed in partnership with state environmental agencies and universities, would allow science-based effluent limits that reflect local receiving-water sensitivity rather than generic national standards.
Funding design: Conditional grants tied to technology adoption and verified performance metrics are more effective than unconditional subsidies. Public-private partnerships for feed innovation, particularly alternative protein development, can leverage private R&D investment while ensuring that resulting technologies are accessible to smaller domestic producers. Metrics-based procurement, where government buyers pay a premium for verified low-impact product, creates a durable revenue signal that sustains investment beyond the grant period.
The sustainable aquaculture sourcing guide offers practical procurement criteria that align with these policy directions and can serve as a reference for institutional buyers developing low-impact sourcing standards.
Key Takeaways
Aquaculture's environmental footprint is dominated by feed production and on-farm energy, and reducing those two hotspots through targeted technical and policy interventions offers the highest-return path to measurable sustainability gains.
| Point | Details |
|---|---|
| Feed and energy dominate | Feed production and on-farm energy drive GWP, eutrophication, and resource use across nearly all farmed species and systems. |
| Methodology shapes the number | Functional unit, system boundary, and co-product allocation can shift reported GWP by 30–50%; always verify these before comparing studies. |
| Species heterogeneity is large | Bivalves and seaweeds carry the lowest footprints; carnivorous finfish and shrimp sit at the high end; no single metric applies across taxa. |
| U.S. data infrastructure is the binding constraint | No national database of farm-level FCR, energy use, or feed sourcing exists; building one is the prerequisite for evidence-based federal policy. |
| Demeterbioscience's model | Demeterbioscience's land-based, Dunaliella-fed brine shrimp offers a verifiable, single-ingredient feed input that researchers can evaluate against standard LCA inventory criteria. |
The case for demanding more from footprint claims
The aquaculture sector has a credibility problem with environmental claims, and it is largely self-inflicted. Vendors, certification bodies, and advocacy groups routinely cite footprint numbers without disclosing the methodological choices that produced them. A salmon LCA that excludes LUC emissions from soy can look dramatically cleaner than one that includes them, and both can be published in peer-reviewed journals without either being wrong. The problem is selective presentation, not bad science.
What the evidence actually supports is a more nuanced position: aquaculture's aggregate climate contribution is genuinely modest relative to terrestrial livestock, but its localized impacts on water quality and biodiversity can be severe, and those impacts are highly manageable through known interventions. The sector does not need to choose between growth and environmental performance. It needs to choose between transparent accountability and continued reliance on cherry-picked metrics.
For researchers and policymakers, the practical implication is straightforward. Demand the full methodological disclosure, not just the headline number. When a producer or certification body claims a low footprint, ask for the functional unit, the system boundary, the allocation method, and the sensitivity analysis. If those four items are not available, the claim is not verifiable. That standard should apply equally to large corporate producers and to small, mission-driven companies, including those whose products appear in this guide.
The trade-off between water savings and electricity intensity in closed systems is a good example of where the nuance matters. RAS can genuinely reduce water use and effluent risk, but on a coal-heavy grid, the GHG cost of that electricity can exceed the savings from reduced nutrient discharge. The right answer depends on local conditions, and any claim that ignores local grid mix is incomplete. Readers evaluating RAS investments or policies should insist on grid-specific GHG calculations, not national averages.
Demeterbioscience's live brine shrimp as a lower-impact feed input
Researchers and institutional buyers evaluating feed inputs for low-impact aquaculture systems have a concrete option worth examining: Demeterbioscience's land-based, microalgae-fed live brine shrimp. The cultivation model feeds Artemia exclusively on Dunaliella algae in controlled, land-based systems, delivering a minimum 40% protein content with a consistent nutritional profile that wild-harvested alternatives cannot reliably match.
The sustainability case rests on three verifiable pillars: a single, cultivated feed input (simplifying the upstream inventory), land-based production that eliminates open-water effluent risks, and controlled feeding conditions that support lower FCRs than unmanaged wild-harvest systems. For researchers building LCA inventories for ornamental fish or aquaculture nutrition studies, the product's simplified feed chain is a genuine analytical advantage. For institutional buyers, the consistent protein content reduces the nutritional variability that complicates diet formulation.
Demeterbioscience supplies live brine shrimp for direct-to-consumer and institutional orders, with bulk purchasing options available for research institutions, museums, and aquaculture operations evaluating the product at scale. Researchers seeking inventory-level data for footprint evaluation are encouraged to contact the company directly to request feed input specifications, on-farm energy data, and transport logistics. Product claims should be evaluated against the LCA reporting checklist in this guide; independent verification of the inventory is the appropriate standard for any feed input entering a peer-reviewed footprint study.
Useful sources
The sources below are the primary references for the data, methods, and policy frameworks discussed in this guide.
-
Quantifying greenhouse gas emissions from global aquaculture (Scientific Reports): The most-cited estimate of aquaculture's global GHG contribution (~263 Mt CO2e in 2017). Essential for contextualizing any national or farm-level footprint against the global total. Supports the BLUF section and the global findings table.
-
Environmental sustainability and footprints of global aquaculture (ScienceDirect): Source for the FEWC composite index applied at country scale (2018 data: energy, water, and GHG totals). The methodological framework for FEWC nexus analysis. Supports sections on conceptual models and global findings.
-
Environmental sustainability and footprints of global aquaculture (Nature Communications): Covers feed and energy as dominant hotspots, RAS/biofloc trade-offs, IMTA as a mitigation pathway, and FCR as a leverage variable. The single most useful review for sections on hotspots, species differences, and mitigation strategies.
-
Social benefits and environmental performance of aquaculture need to improve worldwide (Communications Earth & Environment): Global assessment confirming bivalves and seaweeds as lowest-impact taxa. Supports species-differences section and policy recommendations for expanding low-impact production.
-
Life Cycle Assessment of Aquaculture Systems: Environmental Hotspots, Methodological Challenges, and Pathways (Fishery Technology): Comprehensive LCA methodology review identifying functional unit and allocation as primary sources of cross-study variance. Supports measurement methods and reporting guidance sections.
-
Marine aquaculture and the environment (NOAA Fisheries): NOAA's framing of aquaculture environmental performance as management-dependent rather than inherently destructive. The authoritative U.S. federal source for regulatory context.
-
Environmental impacts of wastes and contaminants from aquaculture and their remediation techniques (IntechOpen): Data on feed production growth (29.2 Mt in 2008 to 71 Mt in 2020) and projections for freshwater and feed water footprint increases. Supports hotspot and data-gap sections.
-
Environmental, economic, and social sustainability in aquaculture: the aquaculture performance indicators (PMC): Multi-pillar sustainability framework covering 57 aquaculture systems on 88 metrics. Useful for researchers designing comprehensive sustainability assessments that go beyond LCA.
-
World Aquaculture: Environmental Impacts and Troubleshooting Alternatives (PMC): Broad review of aquaculture environmental concerns including ecosystem destruction, effluent impacts, and mitigation strategies. Background context for the full range of environmental concerns covered in this guide.
-
Towards Environmental Sustainability in Marine Finfish Aquaculture (Frontiers in Marine Science): Focused review of marine finfish sustainability challenges and emerging solutions including polyculture and offshore facilities. Supports species-specific sections and mitigation discussion.