
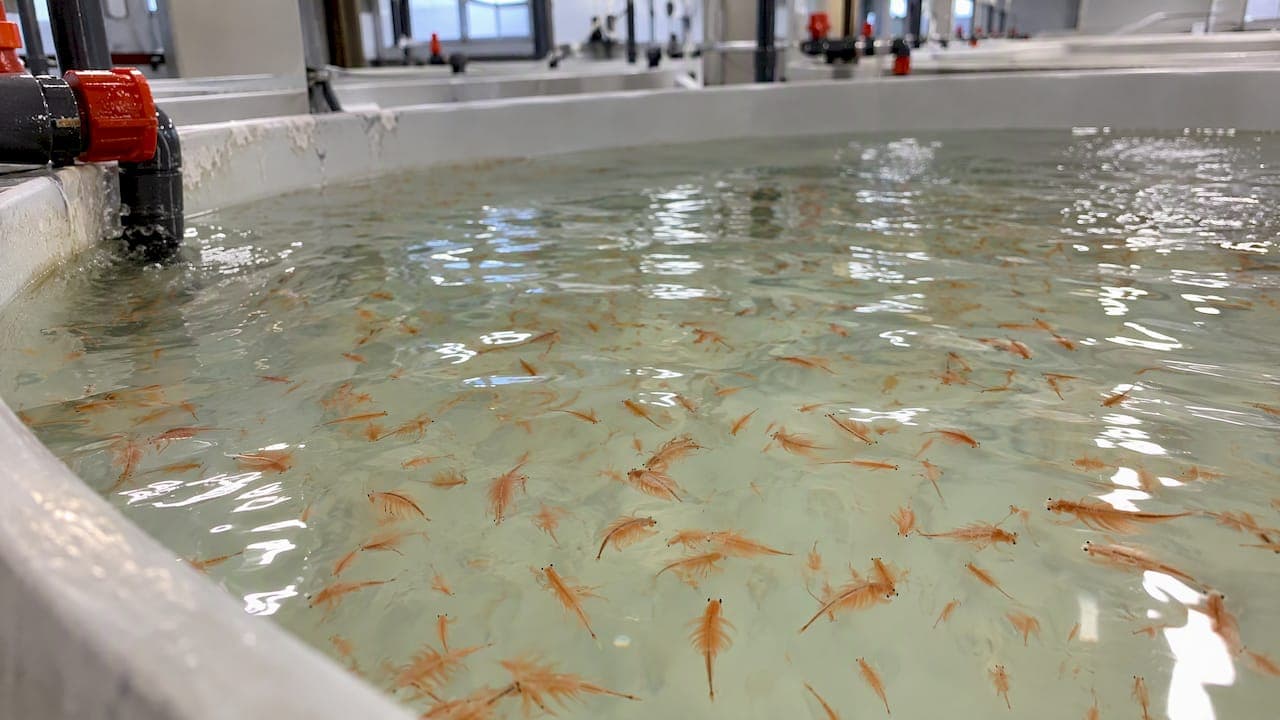
Brine shrimp typically contain roughly 37% to 71% crude protein on a dry-weight basis, and life stage, processing method, and how the protein was measured explain most of that spread. Farmed options with a stated baseline, such as the at least 40% protein that Demeter Biosciences claims for its microalgae-fed shrimp, give you a steadier reference point than wild-harvested batches.
TL;DR:
- At 90% moisture, 100 grams of live nauplii provide about 5 to 6 grams of protein; drying yields about 45 to 57 grams.
- Kjeldahl tests estimate protein from total nitrogen, so chitin can inflate whole shrimp meal results unless labs correct for chitin nitrogen.
- Protein stays stable from 22 to 36 hours after hatching, but digestibility varies; harvesting at 22 to 30 hours often balances yolk reserves and absorption.
- Larvae with small mouths need freshly hatched nauplii because juveniles are too large; rotifers serve smaller mouths, while daphnia can bridge the transition.
Table of Contents
- 1. How protein content shifts by life stage
- 2. Why processing changes the protein number on the label
- 3. How labs measure protein and why the methods matter
- 4. Converting protein percentage into grams you can actually feed
- 5. When protein percentage matters less than digestibility
- 6. How brine shrimp compare with daphnia and rotifers
- 7. What protein content actually does for growth and health
- 8. Sustainability and protein quality in brine shrimp farming
- Why consistency beats a high peak number
- Order live, microalgae-fed brine shrimp direct
- FAQ
- Sources
1. How protein content shifts by life stage
Brine shrimp change composition as they grow, and the published percentages reflect that. Cysts, freshly hatched nauplii, and juveniles or adults each carry their own typical range, and the differences come down to yolk reserves, exoskeleton growth, and how much of the body mass is active tissue versus storage.
Several proximate studies converge on a similar picture: Artemia meal commonly falls between 40% and 60% crude protein on a dry-matter basis, while the wider literature on dried nauplii spans the 37% to 71% range once you account for strain, diet, and harvest timing.
| Life stage | Typical protein (% DW) | Typical lipid (% DW) | Typical carbohydrate (% DW) | Typical ash (% DW) |
|---|---|---|---|---|
| Cysts | 40-55 | 15-25 | 5-15 | 5-10 |
| Nauplii (freshly hatched) | 45-60 | 10-20 | 5-15 | 8-12 |
| Juveniles/adults | 50-60 | 5-15 | 5-10 | 10-15 |
A few factors drive the variation inside each band:
- Geographic strain: shrimp from different salt lakes or bays show measurably different baseline composition.
- Diet before harvest: wild populations eating whatever algae bloom is available swing more than farmed stock on a fixed feed.
- Harvest timing: nauplii pulled at different hours post-hatch carry different proportions of yolk versus tissue.
Those production variables matter more than most buyers realize, and our amino-acid breakdown digs into how they translate into feeding value.
2. Why processing changes the protein number on the label
The same batch of shrimp can report very different protein percentages depending on how it was handled before testing. None of this means the shrimp got more nutritious. It means water, shell, and other non-protein mass were removed or altered, which shifts what fraction of the remaining weight is protein.
A few processing effects explain most label differences:
- Drying concentrates everything: removing water raises the protein percentage per gram of remaining mass without adding protein.
- Freezing and heat can degrade some fatty acids and vitamins, though crude protein readings are comparatively stable.
- Decapsulation strips the chorion shell from cysts, which removes non-nutritive mass and tends to raise the measured protein percentage.
- Enrichment loads nauplii with extra fatty acids and vitamins before feeding, and this changes feeding value far more than it changes the crude protein figure.
Pro Tip: When comparing two products' protein claims, check whether both are reported on the same moisture basis before assuming one is actually more concentrated.
Enrichment protocols are worth understanding on their own terms. Our guide to brine shrimp nutrition for commercial larval fish covers when enrichment helps and when a plain, high-quality live feed is already enough.
3. How labs measure protein and why the methods matter
Most published protein figures come from the Kjeldahl method, which measures total nitrogen and multiplies by a conversion factor to estimate crude protein. That works well for most feed ingredients, but it has a known blind spot: it counts all nitrogen, not just the nitrogen that is actually protein.
Brine shrimp contain chitin in their exoskeleton, and chitin nitrogen can inflate the crude protein number if a lab doesn't correct for it. Peer-reviewed proximate analyses typically rely on AOAC-standard methods, pairing Kjeldahl for protein with drying at 105°C for moisture, Soxhlet extraction for lipids, and a muffle furnace for ash.
The other major source of confusion is moisture basis. A sample reported on a dry-weight basis strips out water first, so the protein percentage looks higher than the same sample reported on a wet-weight (as-fed) basis. Freshly hatched nauplii are roughly 85 to 90% water, so a wet-weight protein figure for live nauplii will look dramatically lower than the dry-weight figure for the same batch.
A few questions help you compare numbers fairly:
- Ask whether the figure is dry-weight or wet-weight before comparing it to another source.
- Ask which method was used (Kjeldahl, Lowry, or another), since conversion factors differ.
- Ask whether chitin nitrogen was corrected for, especially for whole-shrimp meal.
4. Converting protein percentage into grams you can actually feed
Once you know the percentage and the moisture basis, converting to a usable gram figure is straightforward:
- Start with product mass in grams.
- Multiply by (1 minus the moisture fraction) to get dry mass.
- Multiply the dry mass by the protein percentage (as a decimal) to get grams of protein.
Worked example: live nauplii are roughly 90% moisture, so a 100 g sample has about 10 g of dry mass. At a mid-range dry-weight protein figure of 50% to 60%, that dry mass yields roughly 5 to 6 g of actual protein. An oven-dried meal from the same shrimp, at 5 to 10% moisture, keeps 90 to 95 g of dry mass per 100 g, so the same protein percentage yields closer to 45 to 57 g of protein, a far larger number simply because the water is gone.
Keep two rules of thumb handy: live feed always looks lower in protein per gram than dried feed from the identical animal, and any protein figure without a stated moisture basis is incomplete.
5. When protein percentage matters less than digestibility
Crude protein percentage tells you how much nitrogen-based material is in a sample, not how much of it a larval fish can actually absorb. Digestibility studies on Artemia report strong assimilation, often above 90%, which is a bigger driver of growth outcomes than small differences in the headline protein number.
Research shows that harvest timing shifts outcomes more than small protein swings. A recent study on Artemia salina nauplii found crude protein stayed fairly stable across a 22 to 36 hour post-hatch window, while digestibility for target species varied with that same timing window. In practice, harvesting around 22 to 30 hours post-hatch tends to balance leftover yolk reserves against digestibility for many ornamental and food-fish larvae.
Matching life stage to species matters as much as the protein figure itself:
- Small-mouthed larvae need freshly hatched nauplii regardless of the dry-weight protein percentage, because juveniles are physically too large to eat.
- Species with more developed digestive enzymes can handle enriched or slightly older nauplii without a drop in growth performance.
- Larger juveniles and adults suit bigger fish and offer more total mass per feeding event, even when their protein percentage sits in the same range as nauplii.
6. How brine shrimp compare with daphnia and rotifers
Brine shrimp sit toward the high end of common live feeds when it comes to protein density, and that is one reason they dominate hatchery diets worldwide. Rotifers, used heavily for the smallest larval mouths, generally run lower in dry-weight protein than Artemia and are chosen mainly for their tiny size rather than their nutrient density. Daphnia fall into a broad range depending on species and culture conditions, often overlapping with the lower end of the brine shrimp band, but they lack the consistent commercial supply chain that Artemia has.
The practical advantage of brine shrimp isn't just the protein number. It's the combination of a reasonably high, well-documented protein range with a size and swimming behavior that triggers a strong feeding response in larval fish. Rotifers fill the gap for mouths too small for nauplii, and daphnia work well as a secondary or transition feed, but neither replaces brine shrimp as the primary live-feed workhorse once larvae are large enough to handle them.
For hatcheries weighing feed choices side by side, the decision usually isn't protein percentage alone. It's protein percentage combined with particle size, swimming behavior, culture reliability, and how easily the feed scales from a few tanks to commercial volume. Brine shrimp tend to win on that combined scorecard, which is why they remain the default live feed across ornamental and food-fish aquaculture alike.

7. What protein content actually does for growth and health
Protein drives tissue growth, enzyme production, and immune function in larval and juvenile fish, so a feed's protein percentage sets a ceiling on how fast an animal can build new biomass. But the ceiling only matters if digestion and amino acid balance are also adequate. A feed with impressive crude protein numbers but poor digestibility or an incomplete amino acid profile can still produce weak growth.
This is why hatchery operators watch more than the headline percentage. Growth rate, survival rate, and pigmentation in ornamental species respond to the full nutritional package, protein quantity, amino acid balance, and the fatty acids and vitamins that often ride along with enrichment. Underfed or poorly nourished larvae show slower growth and lower survival regardless of how high the protein number on the feed bag reads, which is part of why consistent batch quality matters as much as peak protein values.
For most aquarists and small-scale breeders, the practical takeaway is simpler: feed a protein-dense live food at the right life stage for your species, watch growth and coloration as the real feedback signal, and treat the protein percentage as one input among several rather than the whole story.
8. Sustainability and protein quality in brine shrimp farming
Wild-harvested brine shrimp depend on natural salt lake conditions that shift with season, rainfall, and algae blooms, which is part of why wild batches show such a wide protein range. Controlled, land-based farming systems that feed shrimp a consistent microalgae diet, rather than whatever is available in a lake that season, tend to produce more stable proximate composition batch to batch.

There's also an environmental angle worth noting. Producing feed microalgae like Dunaliella in controlled systems avoids the habitat disruption that comes with heavier wild harvesting pressure on salt lake ecosystems, and it reduces the odds of shrimp experiencing starvation conditions that can lower both yield and nutritional quality. For hatcheries and retailers buying at scale, that combination of steadier nutrition and lower ecological pressure on wild stocks is becoming a real factor in sourcing decisions, alongside straightforward protein percentage.
Why consistency beats a high peak number
Everyone fixates on finding the highest protein percentage, but a single impressive lab result from one batch tells you nothing about the next one. Wild-harvested Artemia can swing from starvation-stressed stock one month to a well-fed bloom the next, and that instability is the real problem, not the average percentage itself.
When sourcing at scale, ask suppliers for batch nutrient specs or a certificate of analysis rather than relying on a marketing range alone.
— Demeter
Order live, microalgae-fed brine shrimp direct
We raise our brine shrimp in controlled, land-based systems on an organic Dunaliella diet, which is how we hold our shrimp to a consistent baseline of at least 40% protein per batch rather than the wide swings common in wild-harvested supply.
- Live brine shrimp ships direct for home aquariums and small breeding setups.
- A Demeter Biosciences membership at $25 per month covers recurring shipments without reordering each time.
- Our bulk order page serves hatcheries, museums, and retailers that need institutional volume.
If you're ready to feed a batch with a known, consistent protein floor instead of guessing at a wild-harvest range, place an order on our live brine shrimp product page today.
FAQ
How much protein is in brine shrimp on average?
Published figures put brine shrimp protein content at roughly 37% to 71% on a dry-weight basis, with most Artemia meal samples landing between 40% and 60%. The exact figure depends on life stage, processing, and whether moisture was removed before testing.
How many shrimp does it take to reach 30 grams of protein?
This depends heavily on whether you mean live brine shrimp (used as aquafeed) or cooked shrimp eaten as human food. For cooked shrimp eaten by people, a typical serving provides roughly 20 g of protein per 85 g (3 oz) portion, so you'd need a bit more than that serving size to reach 30 g.
What seafood has the highest protein content?
Protein content varies widely by species and preparation, and no single seafood holds a fixed, universal top spot. Lean fish and shellfish generally offer dense protein per serving, but exact rankings shift depending on whether you compare raw, cooked, or dried forms.
Is shrimp a healthier protein source than chicken?
Both are lean, high-quality protein sources with different fat and micronutrient profiles, so "healthier" depends on your dietary goals rather than protein content alone. Neither consistently outranks the other on protein percentage per serving once cooking method is held constant.
Is eating 20 shrimp too much in one sitting?
Twenty shrimp can range from a reasonable serving to a large one depending on their size, so there's no fixed answer without knowing shrimp size and your overall daily intake needs. For most adults, portioning by weight (around 85 g) gives a more reliable gauge than counting pieces.
Sources
- Aquaculture of brine shrimp
- Artemia, a New Source of Animal Protein Ingredient in Poultry Nutrition | IntechOpen
- Optimal Time to Harvest Brine Shrimp (Artemia salina) Nauplii as Live Food for Aquatic Animals